|
My current project has to do with making predictions of electricity usage in a building. The predictions could then be compared to real time data. Any anomalies presented between the prediction and real time data must indicate irregular use of electricity. Irregular use of electricity can indicate either a shift in schedule of electricity use or a potential source of electricity wastage. Buildings like our school often operate on a pretty consistent period. With higher electricity usage during the weekdays, specifically during school days and hours… Some classrooms have after school activities which also operate on a periodic schedule in certain parts of the building only on certain days and certain hours… If these periods could be studied and automated predictions could be made for electricity in advance using historical data which was collected every 15 mins for maybe 2-3 years, then we would be able to make accurate predictions accounting hourly, daily, weekly, monthly, and yearly periods… The below image from a study in an academic journal documenting “Real-time detection of anomalous power” (https://ayushzenith.tech/files/Renewable%20reviews%20-%20Real-time%20detection%20of%20anomalous%20power%20consumption.pdf) summarizes my current plan to tackle this issue quite well. 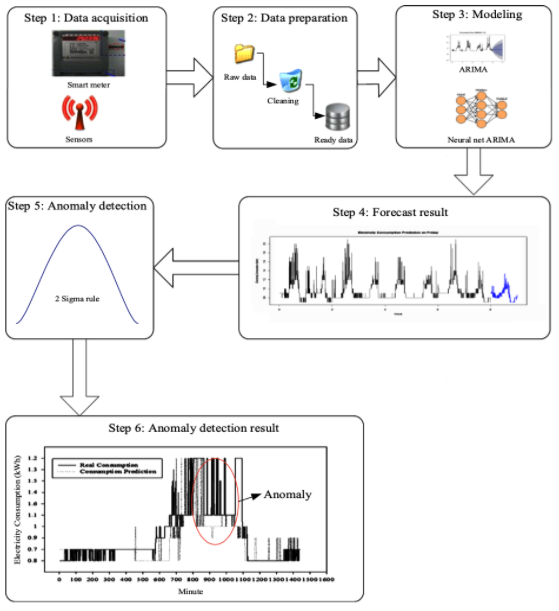 For data acquisition we have sensors and a server communicating on the BACnet protocol through which I can receive data. I am collecting data every 15 minutes and storing it in a mySQL database(for now… In the near future might switch to a more time series effective database. I have done some research and my current method of storing time series data in a SQL db isn't very efficient but there are time series db’s which make storing and querying a lot easier.) This data is then queried by the ARIMA neural network. ARIMA is an acronym that stands for AutoRegressive Integrated Moving Average and is often used to understand or predict future points in time series data. I am currently in the process of writing my ARIMA neural net but there are multiple simple interpretations to writing ARIMA NN to predict electricity usage data(Some of these popular interpretation to which I am referring to include: https://towardsdatascience.com/predict-electricity-consumption-using-time-series-analysis-4650284e40aa which is an article focused on predicting electricity consumption using time series analysis and https://www.machinelearningplus.com/time-series/arima-model-time-series-forecasting-python/ which is just a complete guide to time series forecasting in python). I have looked at some other models too but the ARIMA model is the only I have so far been able to get any remotely accurate results with. While I am currently focused on the prediction model, once I figure it out I would need to work on anomaly detection. While I haven't done a lot of research on this yet I have currently decided to code this based on the plan highlighted by the same study from where I got the above image (https://ayushzenith.tech/files/Renewable%20reviews%20-%20Real-time%20detection%20of%20anomalous%20power%20consumption.pdf). The below image from the same study highlights the plan on finding anomalies between the prediction and real time data(I haven't gotten to this yet and this is just my plan and may change depending on the performance of my prediction model). 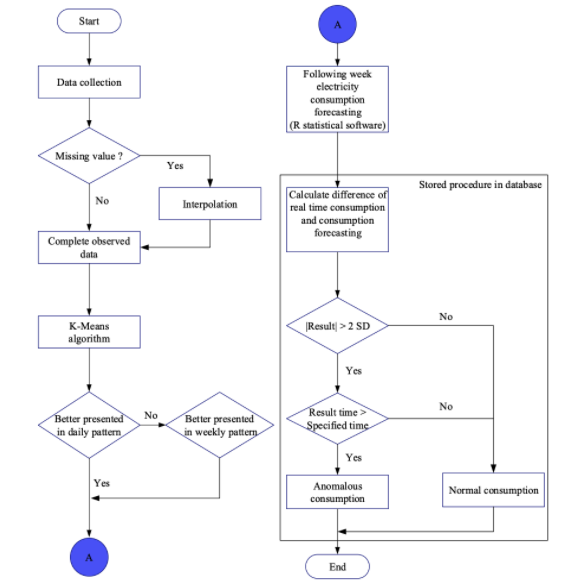 If interested in more detail on the anomaly detection flowchart please refer to the study I picked it up from as it is explained in detail in the study. Once I have the backend for the anomaly detection working I plan on writing a front end so that the respective people are able to identify which room/sensor is currently presenting with anomalous data should be taken a look at. The plan for the front end is something I picked up from an academic study on “Early-warning application for real-time detection of energy consumption anomalies in buildings” (https://ayushzenith.tech/files/Journal%20of%20cleaner%20production%20-%20Early-warning%20application%20for%20real-time%20detection%20of%20energy.pdf). I would possibly like to integrate the front end with Daniel’s dashboard which he has been working on. The below images are from the just mentioned study and summarize my plan for the front end quite well 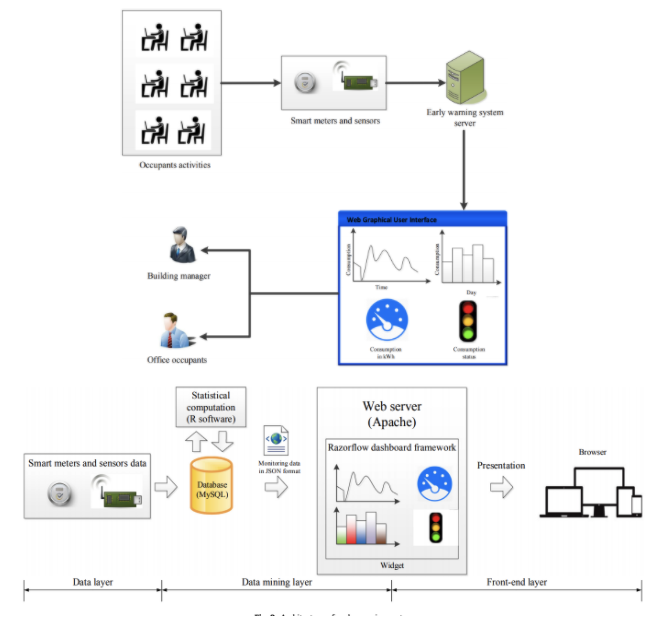
0 Comments
Leave a Reply. |
AuthorHi! My name is Ayush Zenith! I am currently a senior at Andover High School. I have been part of the Energize Andover Program since June, 2017 (8th grade). I have since been working on improving my knowledge in programming and working on writing better applications in order to save and conserve resources in buildings... Archives
November 2020
Categories |
 RSS Feed
